AWS - LOTI Data Skills Platform
Led design for a joint venture SaaS platform between AWS Institute and LOTI London, enabling 33 London boroughs to recruit, train, and share data talent for evidence-based decision-making, transforming how local government approaches data skills development.
The Challenge
As part of an AWS-LOTI collaboration, we faced the challenge that London boroughs were struggling to recruit and retain data talent. There was no centralised model to visualise skills gaps, share resources across councils, or enable evidence-based workforce planning. Each borough operated in isolation, competing for the same limited talent pool while lacking visibility into their collective capabilities.
The Solution
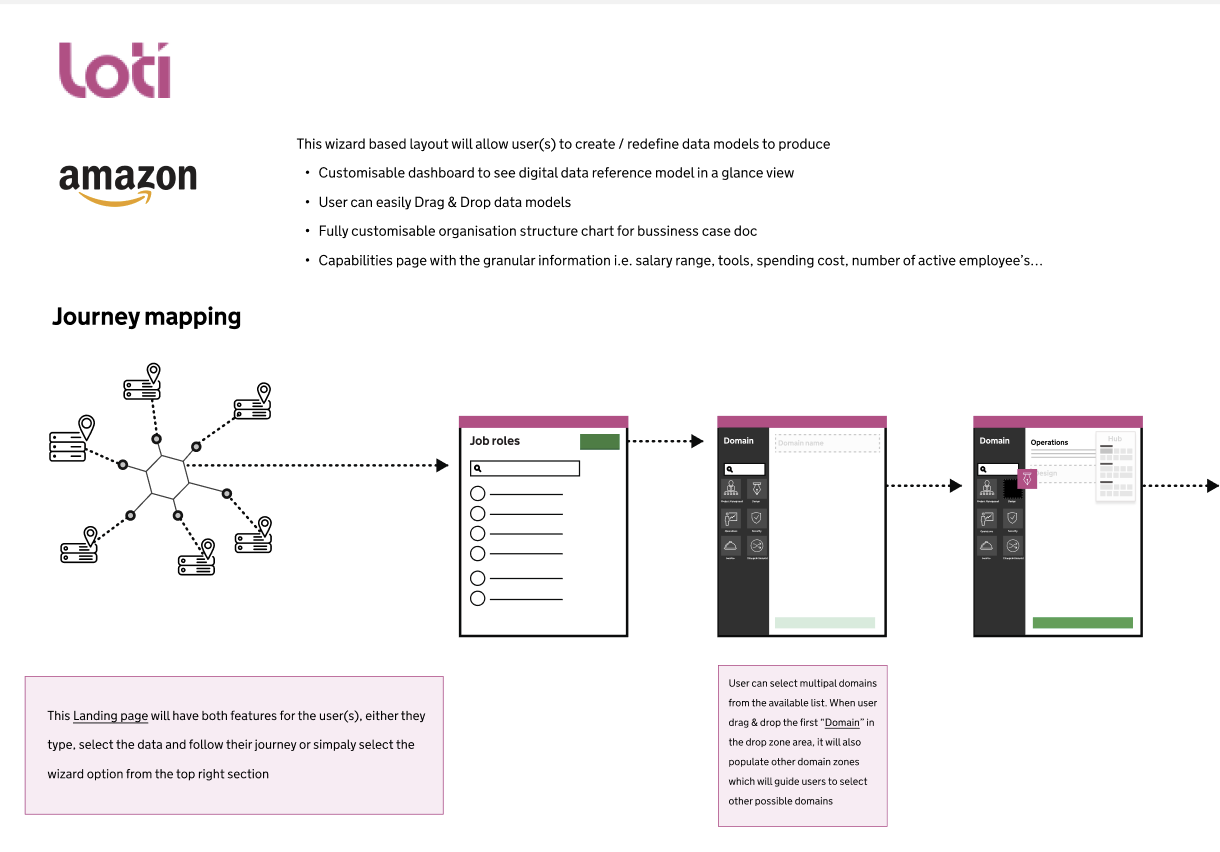
Through this AWS-LOTI joint venture, I led two intensive design sprints - the first focused on discovery and mapping the "Data Skills Landscape" across boroughs, the second on rapid prototyping and usability testing with council data analysts. Designed intuitive dashboards leveraging Amazon QuickSight and Tableau principles that allowed non-technical council leaders to visualise talent density and skills gaps. Created a scalable architecture supporting collaboration between distinct boroughs while maintaining data governance.
Discovery & Research
- 1Stakeholder interviews with LOTI leadership and borough data leads
- 2Mapping the "Data Skills Landscape" across participating boroughs
- 3Workshops with council data analysts to understand daily challenges
- 4Competitive analysis of existing talent management platforms
- 5User interviews with non-technical council leaders to understand data needs
Design Sprint Approach
Intensive, time-boxed sprints to move from ambiguity to validated prototype
Discovery Sprint
1 weekUnderstanding the problem space
Activities
- Stakeholder interviews with LOTI leadership
- Mapping the current "Data Skills Landscape"
- Identifying key user personas across boroughs
- Defining success metrics for the platform
- Prioritising features through dot voting
Outputs
Prototyping Sprint
1 weekRapid design and validation
Activities
- Rapid wireframing of key user flows
- High-fidelity dashboard prototyping
- Usability testing with council data analysts
- Iteration based on user feedback
- Handoff preparation for development
Outputs
What We Learned
Isolation Problem
Each borough had built bespoke approaches to data skills development with no visibility into what other councils were doing or what skills existed nearby.
Leadership Gap
Non-technical council leaders struggled to understand data capabilities, making it difficult to advocate for investment or make evidence-based decisions.
Talent Scarcity
Boroughs were competing for the same small pool of data professionals rather than developing shared resources or talent pipelines.
Knowledge Silos
Best practices and successful approaches weren't being shared between councils, leading to repeated mistakes and missed opportunities.
Quantification Challenge
Without clear metrics on skills gaps, boroughs couldn't build business cases for training budgets or new hires.
Design Principles
Clarity for Non-Technical Users
Council leaders aren't data experts. Every visualisation needed to communicate insights at a glance without requiring technical knowledge.
Actionable Intelligence
Data without action is useless. Every dashboard element was designed to prompt a decision or next step.
Collaboration by Default
The platform architecture assumed cross-borough sharing, making collaboration the path of least resistance.
Scalable Foundation
Designed for 33 boroughs with potential to scale to other UK regions. Component-based architecture allowed rapid customisation.
Data Governance Built-In
Respected the autonomy of individual boroughs while enabling aggregated insights at the LOTI level.
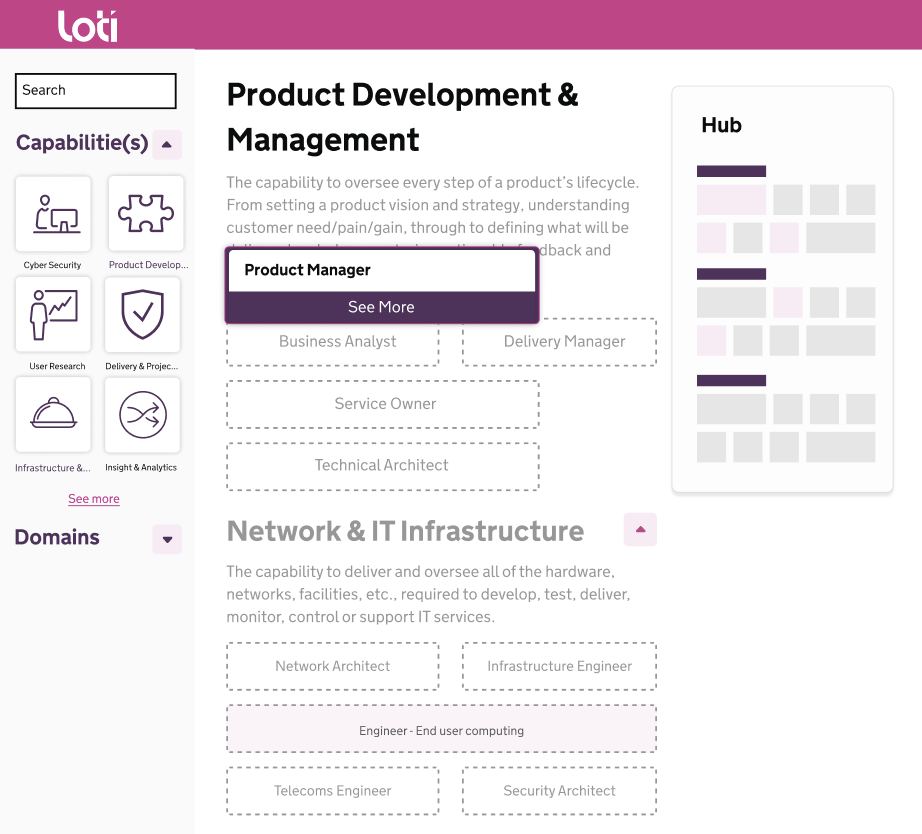
Making Complex Data Actionable
Skills Density Dashboard
Interactive heat map showing data talent distribution across London boroughs. Enabled leaders to identify skills clusters and gaps at a glance.
Design insight: Leveraged Amazon QuickSight patterns to create familiar, intuitive visualisations for users already working with AWS tools.
Capacity Planning Module
Forecasting tool allowing boroughs to model future skills needs based on policy priorities and project pipelines.
Design insight: Used Tableau-style progressive disclosure - summary view for executives, drill-down for analysts.
Talent Sharing Network
Marketplace-style interface connecting boroughs with available expertise to those with specific project needs.
Design insight: Designed trust indicators and previous collaboration history to reduce friction in cross-borough partnerships.
Training & Development Tracker
Individual and team skills progression tracking with recommended learning pathways based on borough priorities.
Design insight: Gamification elements to encourage ongoing engagement without feeling corporate or patronising.
Visualising Capacity for Non-Technical Leaders
Tools & Platforms
Design Principles for Data
- 1
Used familiar visual metaphors (traffic lights, heat maps) to communicate complex data
- 2
Designed for "glanceability" - key insights visible within 3 seconds
- 3
Progressive disclosure: summary → detail → raw data, based on user need
- 4
Consistent colour coding across all visualisations for faster comprehension
- 5
Always paired numbers with context (benchmarks, trends, comparisons)
Measured Results
"Kam's ability to translate our complex requirements into intuitive visualisations was exceptional. He understood that our users aren't data scientists - they're council leaders who need to make decisions quickly. The platform he designed makes complex data accessible to everyone."
What I Learned
- 1
Design sprints are perfect for public sector innovation - they create momentum in traditionally slow-moving organisations
- 2
Data visualisation for non-technical users requires ruthless simplification - if it needs explanation, it needs redesign
- 3
Cross-organisational platforms need to balance individual autonomy with collective benefit
- 4
Prototyping with real data (even sample data) reveals issues that placeholder content never will
- 5
Public sector users are sophisticated - they appreciate good design and will champion it internally